Introduction
ComPass is an application for querying and analyzing Connectivity Map data1, also known as L1000 data but could be extended for other types of data as well. It captures the essential tasks that researchers ordinarily execute as batch processes in a realtime web interface. ComPass provides four interactive workflows and offers a variety of technical features, including compound and target annotations, the ability to export data to CSV and JSON formats, and more.
ComPass is developed by Data Intuitive, is Open Source and freely available.
Customization for Pharma Client: Enhancing Data Integration and Analysis
Data Intuitive recently engaged in a project with a second undisclosed top 10 pharma client. As part of the project, we meticulously prepared and optimized the client’s datasets for seamless integration with ComPass. Additionally, we tailored the ComPass to meet the unique requirements of the client, ensuring that it perfectly aligned with their specific research needs.
We take immense pride in our commitment to open-source development, and any customization performed during the project is thoughtfully integrated into the latest open source version of the ComPass Tool. However, it’s essential to note that personalization of ComPass in industry remains exclusively accessible to the client for whom these were developed.
By providing our client with this tailor-made solution, we have significantly enhanced their data analysis capabilities, allowing them to derive valuable insights and drive meaningful advancements in their research. As a trusted partner in biotechnology, we uphold the highest standards of confidentiality, and while we cannot disclose the details of this specific project, we are delighted to have contributed to the success of our client’s scientific endeavors.
The Compass tool consists 4 of workflows:
The Disease Workflow
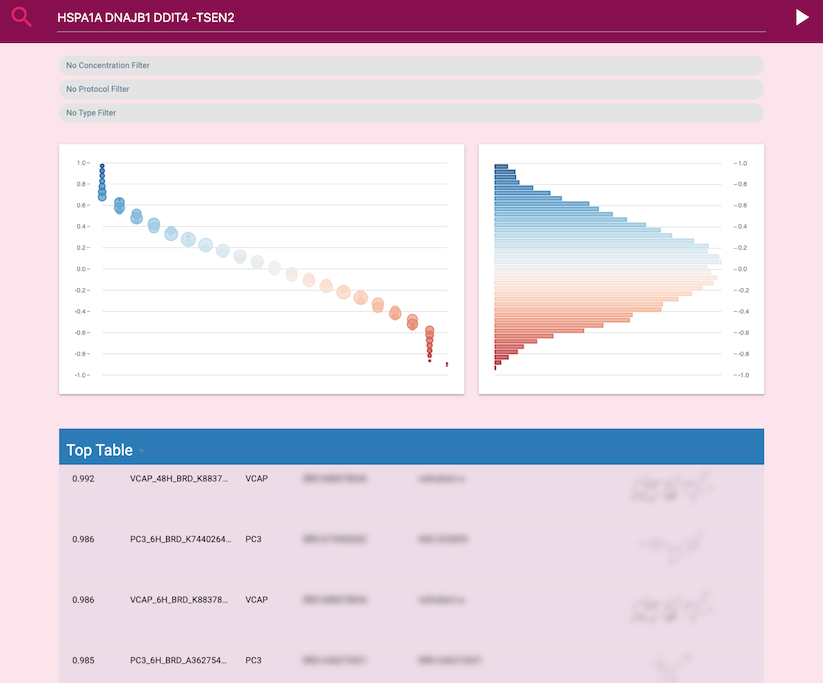
The disease workflow allows users to search for samples or compounds that are highly correlated or anti-correlated to a gene signature related to a specific disease or other biological effect.

The Correlation Workflow
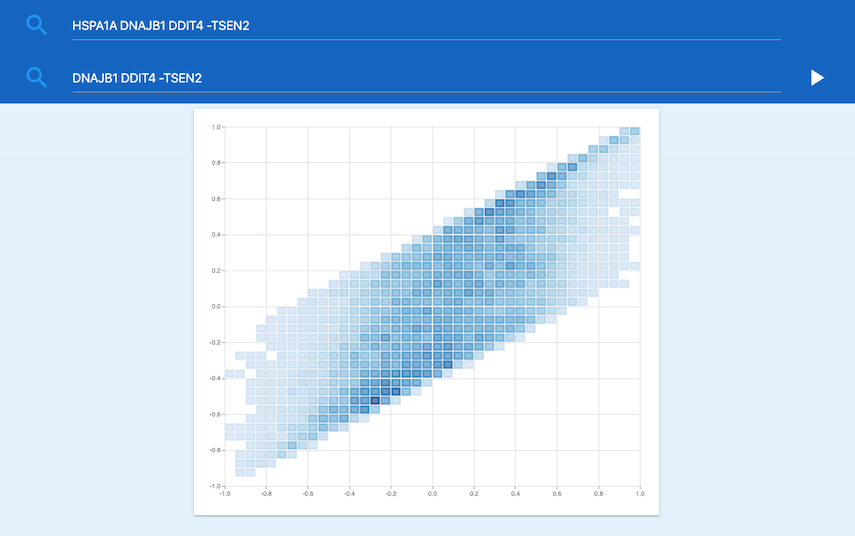
The Correlation workflow enables users to compare two gene signatures (or two compounds) by calculating and plotting Zhang scores. The data points in this plot are binned to ensure scalability.

The Compound Workflow
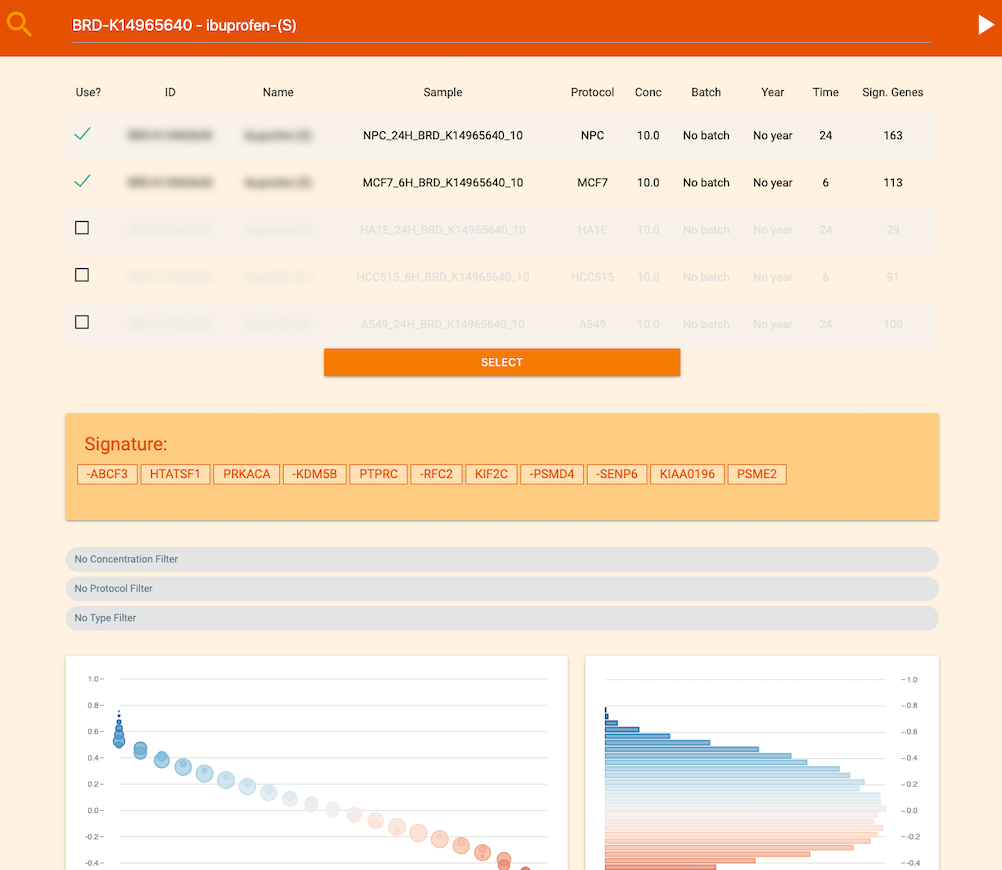
The Compound workflow allows users to generate a gene signature of genes that are highly correlated with samples available for a specific compound. It also performs a similarity analysis on the generated signature, similar to the Disease workflow.

The Target Workflow
The Target workflow enables users to search for compounds that are known to affect well-known and experimentally validated target genes in the L1000 subset of genes. Users can view the correlation of these targets with all available samples.
Footnotes
The Connectivity Map: Using Gene-Expression Signatures to Connect Small Molecules, Genes, and Disease (https://www.science.org/doi/10.1126/science.1132939)↩︎